Industrial thermal imaging detects temperature anomalies before they become failures. Electrical faults, insulation breakdowns, moisture intrusion, and mechanical stress all generate heat signatures: invisible to the naked eye but clear in infrared. For infrastructure owners in Southwest Florida managing commercial roofs, electrical substations, manufacturing facilities, or utility assets, the difference between proactive detection and reactive repair is measured in tens of thousands of dollars.
Most costly infrastructure failures begin as small thermal anomalies. A loose electrical connection generates excess resistance heat months before it arcs. A roof membrane leak allows moisture infiltration that shows as a cool signature long before interior damage appears. Thermal drone inspections reveal these issues early: before downtime, before safety incidents, before major capital expenditures.
But thermal imaging isn't point-and-shoot. Accurate, actionable data requires careful mission planning, proper environmental conditions, and an understanding of the technical variables that drive thermographic reliability.
Mission Planning: Environmental Conditions That Matter
Thermal imaging accuracy depends on environmental delta: the temperature difference between the target and its surroundings. Delta-T (ΔT) of at least 10°F between the anomaly and baseline surface is the minimum threshold for reliable detection. Insufficient delta produces ambiguous data that leads to false positives or missed defects.
Time of day drives delta-T. For roofing inspections, the ideal window is late evening or early morning when wet insulation retains heat while dry membrane cools: creating maximum thermal contrast. For electrical inspections under load, midday or afternoon flights capture systems at peak operating temperature. Mechanical equipment inspections work best after sufficient runtime to reach steady-state operating conditions.
Wind affects surface temperature uniformity. Wind speeds above 15 mph create convective cooling that masks thermal signatures and reduces detection reliability. Cloud cover and ambient temperature matter too: overcast conditions reduce solar loading variability, while extreme heat or cold compress the delta-T range available for differentiation.
Why This Matters:
Flying in poor conditions wastes resources and produces unreliable data. Scheduling inspections during optimal environmental windows ensures the temperature differentials needed for accurate anomaly detection.
Technical Variables: Emissivity, Reflectivity, and Calibration
Emissivity defines how efficiently a material radiates infrared energy. Concrete, asphalt, and matte-finish metals have high emissivity (0.85–0.95): they radiate heat accurately. Shiny metals, glass, and reflective coatings have low emissivity: they reflect surrounding temperatures instead of radiating their own, creating false readings.
Reflected apparent temperature must be accounted for when imaging reflective surfaces. A polished electrical busbar may appear hot because it's reflecting the thermal signature of a nearby heat source, not because the busbar itself is overheating. Setting the correct reflected temperature in your thermal camera compensates for this effect.
Distance and angle affect resolution and accuracy. Thermal cameras lose spatial resolution with distance: a defect clearly visible at 50 feet may blur into the background at 150 feet. Oblique angles reduce apparent temperature readings and introduce geometric distortion. Imaging perpendicular to the target surface whenever possible maintains measurement accuracy and spatial fidelity.
Focus and calibration are non-negotiable. Thermal lenses require manual focus for each target distance: autofocus doesn't exist in most industrial thermal sensors. Out-of-focus imagery blurs temperature gradients and masks small anomalies. Radiometric calibration drift over time degrades absolute temperature accuracy, requiring periodic recalibration against known-temperature reference sources.
Infrastructure Applications: What Thermal Imaging Reveals
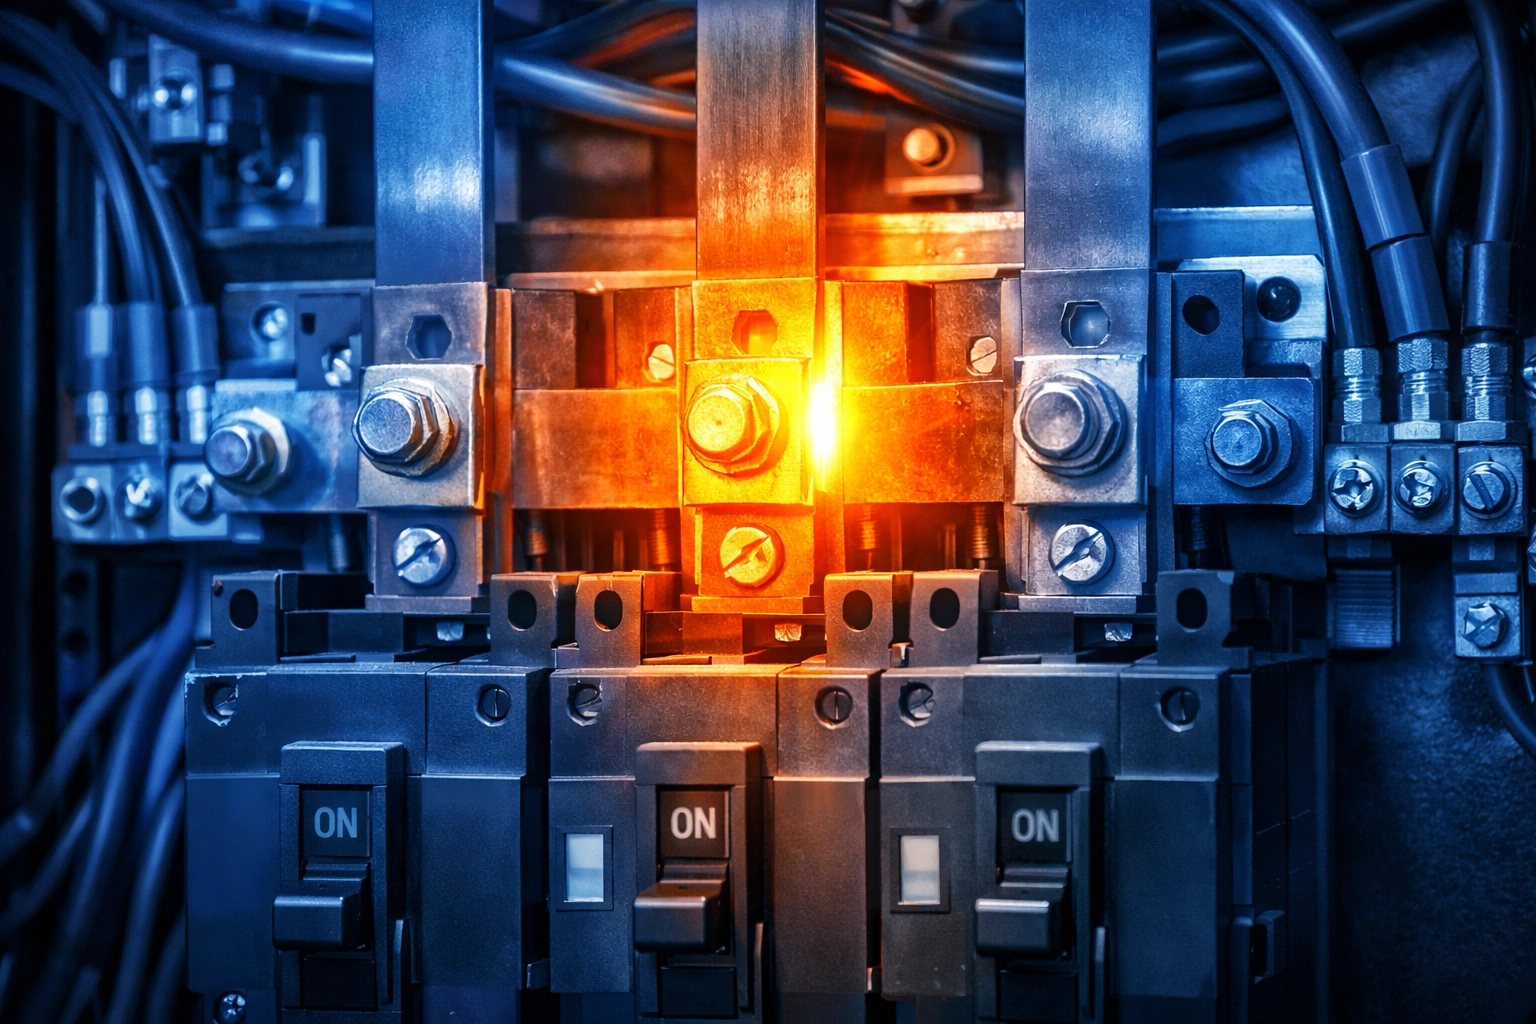
Electrical Systems
Electrical faults generate excess heat long before they fail catastrophically. Loose connections create resistance hot spots. Overloaded circuits run above nameplate temperature. Phase imbalances show as uneven heating across three-phase equipment. Thermal imaging detects these anomalies during live operation: without shutting down systems, without contact, without arc flash risk.
Inspect electrical panels, transformers, switchgear, cable terminations, and motor control centers. Establish thermal baselines during normal operation, then compare subsequent inspections to detect temperature creep over time. A 10°C rise above baseline on a cable termination signals developing failure: detected early enough to schedule repair during planned downtime rather than emergency outage.
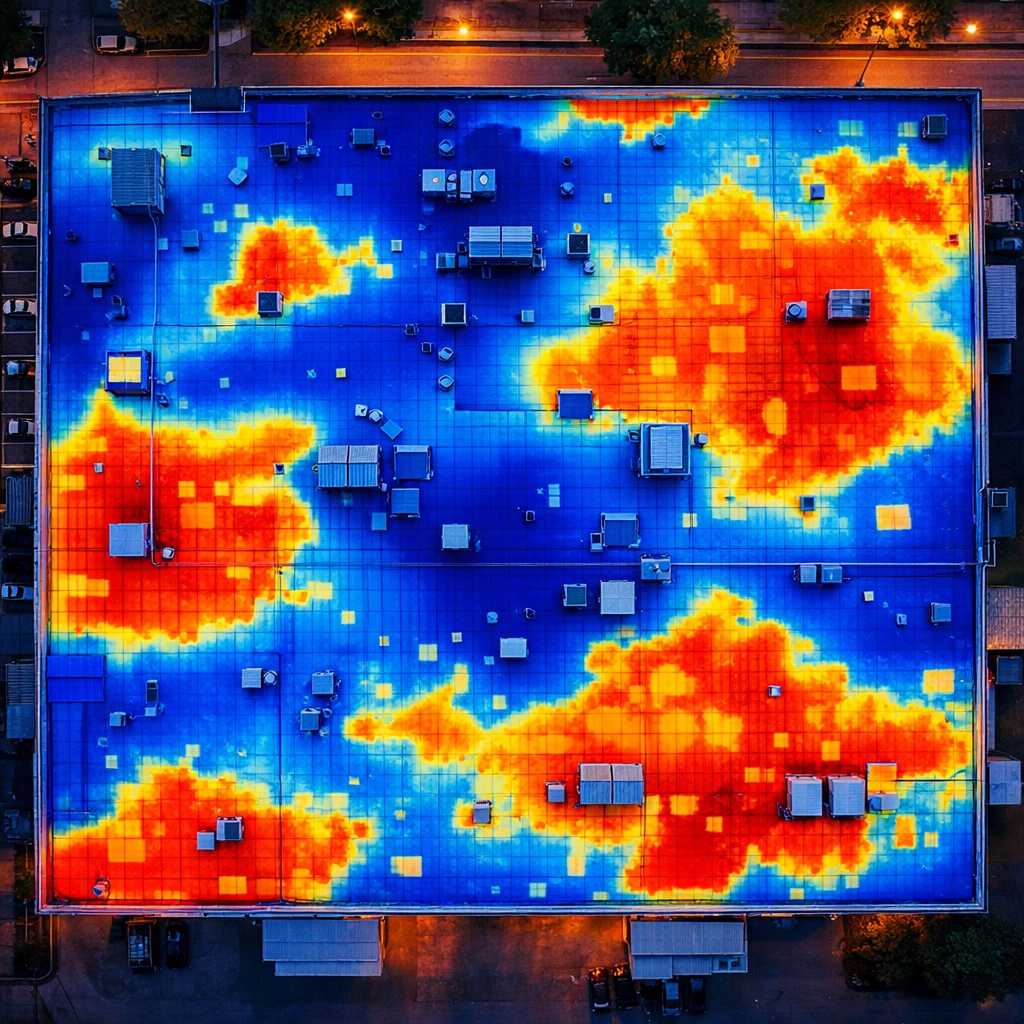
Roofing & Building Envelope
Moisture trapped in roof insulation changes thermal mass: it stays warmer at night and cooler during the day than dry insulation. Thermal imaging maps wet areas across large commercial roofs in a single flight: no destructive testing, no walking the entire roof, no ladders. This pinpoints repair zones, eliminates unnecessary membrane removal, and extends roof service life through targeted maintenance.
Building envelope leaks show as temperature differentials at walls, windows, and penetrations. Air infiltration around doors and loading docks appears as thermal plumes. Missing or damaged wall insulation creates cold spots in winter, hot spots in summer.
Mechanical & Process Equipment
Bearings, motors, pumps, and gearboxes generate predictable heat signatures during normal operation. Elevated bearing temperatures indicate lubrication failure or misalignment: detected weeks before vibration analysis picks up the problem. Heat exchanger fouling shows as uneven temperature distribution across tube bundles. Steam trap failures appear as cold spots on what should be hot lines or vice versa.
Thermal imaging enables condition-based maintenance instead of time-based PM schedules: inspect equipment thermally, repair only what shows anomalies, extend service intervals on healthy assets.
Underground Utilities & Distribution
Buried electrical faults, steam leaks, and hot water distribution losses are invisible from the surface: except in infrared. Thermal imaging from drones detects underground anomalies through surface temperature patterns without excavation, without ground-penetrating radar, without shutting down service. A buried electrical fault heats the soil above. A steam leak creates a thermal plume at grade.
This is particularly valuable for large campus facilities, industrial parks, and utility networks where underground infrastructure spans acres.
Deliverables: From Raw Data to Actionable Reports
Raw thermal imagery is data, not intelligence. Useful deliverables include:
- Radiometric thermal imagery with embedded temperature measurements: each pixel contains an absolute temperature value, not just a color-mapped visual
- Annotated reports identifying each anomaly's location, severity classification, and recommended action priority
- Fusion overlays blending thermal and visible-light imagery to provide spatial context: technicians can locate the flagged electrical connection or roof section from the ground
- Temperature trend graphs for repeat inspections showing whether anomalies are stable, worsening, or resolved
- GIS-tagged anomaly maps for large facilities, enabling integration with CMMS platforms and work order systems
ROI Advantage:
Properly formatted deliverables eliminate interpretation ambiguity. Maintenance teams receive exact locations, severity classifications, and repair priorities: not vague "hot spots." This reduces follow-up site visits, speeds repair planning, and ensures critical issues get addressed first.
Common Mistakes & System Limitations
Mistake 1: Ignoring emissivity settings.
Default emissivity (often 0.95) produces incorrect temperature readings on metallic or reflective surfaces. Always adjust emissivity to match the target material or use reference targets with known emissivity.
Mistake 2: Flying in suboptimal conditions.
Insufficient delta-T, high winds, or solar loading during midday roof inspections compromise data quality. Poor conditions mean paying twice: once for bad data, again for the re-flight.
Mistake 3: Over-relying on absolute temperature values.
Thermal imaging excels at detecting relative temperature differences: this component is hotter than that one. Absolute temperature measurement requires careful calibration, distance correction, and emissivity compensation. Focus on comparative analysis and temperature differentials, not absolute readings, unless the system is calibrated for that purpose.
Limitation: Thermal imaging can't see through obstructions.
Insulation, coatings, and surface layers block infrared transmission. A defect beneath a membrane or inside a wall cavity won't appear unless it generates enough heat to conduct to the surface. Underground utilities require sufficient depth-to-surface heat transfer to be detectable.
Limitation: Training matters.
Misinterpreting thermal signatures leads to false positives (flagging solar reflection as a defect) or false negatives (missing a subtle anomaly amid temperature noise). Qualified thermographers certified through ITC, ASNT, or equivalent programs ensure reliable analysis.
Compliance, Safety & Site Coordination on Active Industrial Sites
Industrial and utility sites present operational and safety constraints beyond typical aerial work. Cape UAV operates under FAA Part 107 commercial certification with full liability and hull insurance coverage: mandatory for any contractor entering active infrastructure sites.
Pre-flight coordination includes lockout/tagout awareness where required, hot work permits if applicable, and coordination with site safety personnel. Drone operations near energized electrical equipment follow NFPA 70E arc flash boundaries and maintain minimum approach distances. For rooftop inspections on occupied buildings, flight plans avoid ventilation intakes and ensure no operational disruption.
Active construction sites require coordination with general contractors regarding temporary flight restrictions (TFRs), crane operations, and workforce notifications. Proper site safety integration protects your workers, our pilots, and ensures inspections happen on schedule without delays or incidents.

Cape UAV uses enterprise-grade thermal imaging platforms: radiometrically calibrated sensors integrated with high-resolution visual cameras for fusion deliverables. Missions follow structured flight planning that accounts for sun position, wind forecast, and optimal thermal imaging windows specific to your asset type.
When Thermal Imaging Pays for Itself
A single undetected electrical fault causes unplanned downtime measured in lost production hours: often tens of thousands of dollars per hour for manufacturing facilities. Thermal inspections cost a fraction of one hour's downtime. A missed roof leak allows moisture damage to spread across insulation and structure, turning a $5,000 membrane repair into a $50,000 roof replacement.
Thermal imaging shifts infrastructure management from reactive to predictive. You repair on your schedule, during planned outages, with materials and contractors already staged. You avoid emergency callouts, overtime labor rates, and expedited parts shipping.
For multi-building campuses, annual thermal surveys become the baseline; track degradation over time, prioritize capital spending, and extend asset life through proactive intervention. The data compounds in value with each inspection cycle.
Thermal imaging for infrastructure isn't new technology; it's proven methodology now delivered faster, safer, and more comprehensively via drone platforms. Proper planning, optimal conditions, and qualified analysis turn raw thermal data into cost-avoiding intelligence.