Drone mapping has evolved from a niche hobbyist pursuit into a critical utility for construction, land development, and facility management. In Southwest Florida, where development moves at a rapid pace and terrain can be complex, high-resolution aerial visualization provides a level of site awareness that traditional methods simply cannot match. This guide breaks down the technical fundamentals of drone mapping, the hardware that makes it possible, and the business intelligence it delivers to stakeholders in Cape Coral and beyond.
The Fundamentals of Aerial Photogrammetry
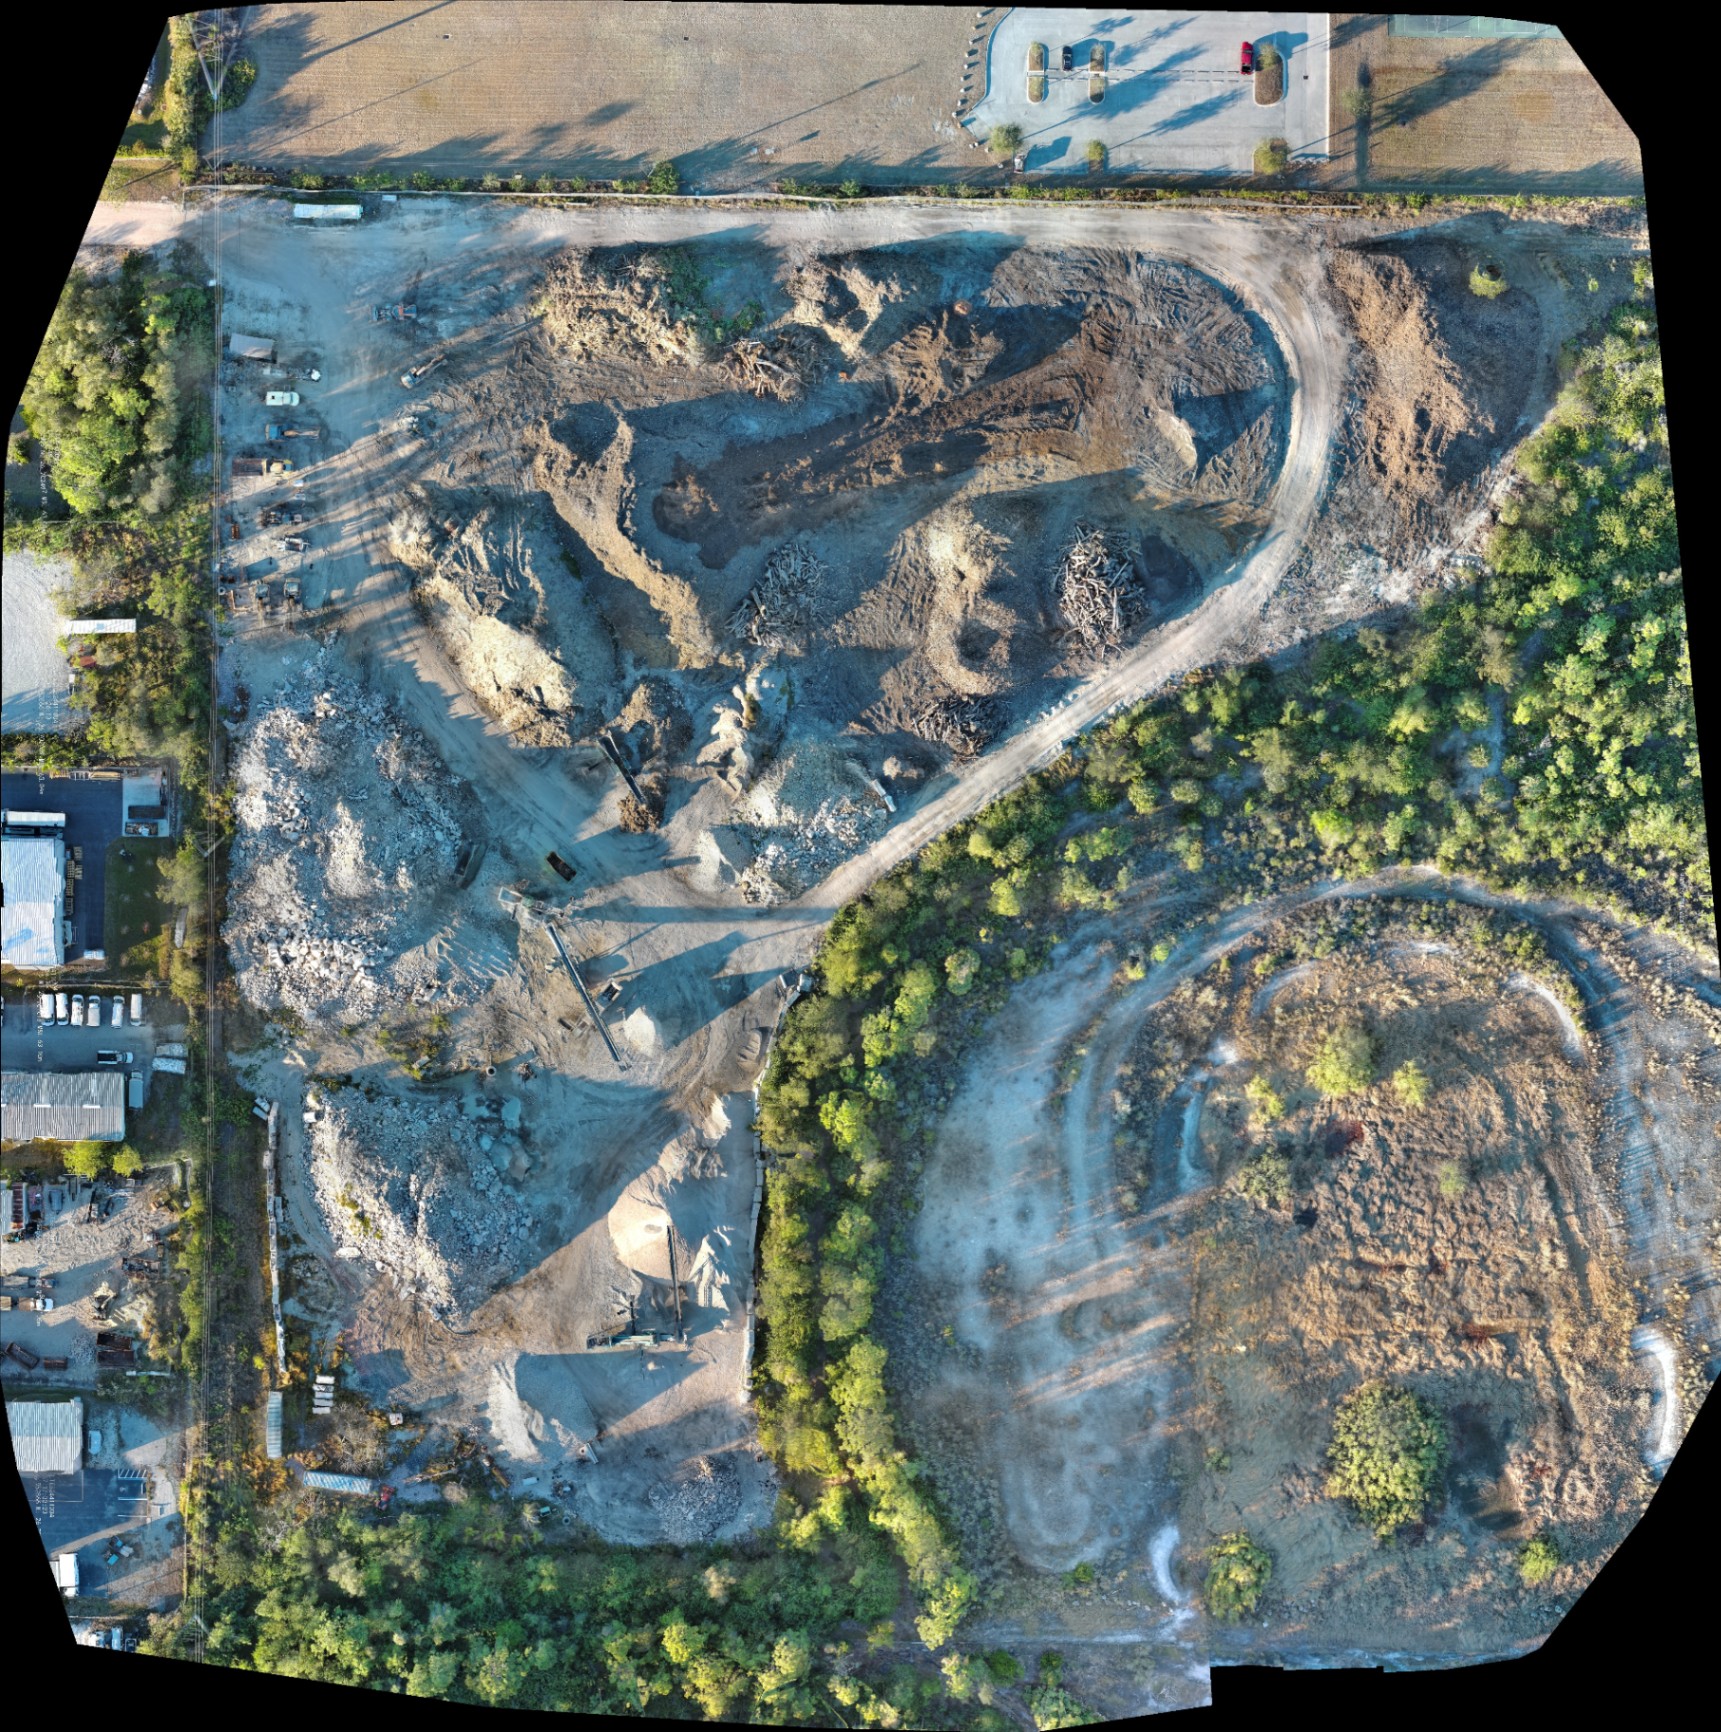
At its core, drone mapping is the process of capturing a series of overlapping aerial images and "stitching" them together using photogrammetry software. Unlike a single aerial photograph, a drone map is a georeferenced composite. Every pixel contains data that helps reconstruct the physical world in a digital space.
To achieve this, we utilize a specific flight pattern: usually a "lawnmower" or grid path. The drone follows a pre-programmed route, triggering the camera at precise intervals. For high-quality site visualization, we typically aim for a 70-80% frontal overlap and at least 60% side overlap. This redundancy ensures that the software can recognize common features across multiple images, allowing for the accurate reconstruction of depth and elevation.
Why Overlap Matters
- Geometric Fidelity: High overlap reduces distortion at the edges of the map.
- Elevation Accuracy: More data points allow the software to build more reliable Digital Surface Models (DSM).
- Visual Clarity: Overlap eliminates "blind spots" caused by tall structures or dense vegetation.
The Enterprise Hardware: Autel Robotics EVO Lite 6T
Not all drones are created equal. For professional drone mapping and site visualization, the hardware must balance high-resolution visual capture with enterprise-grade thermal capabilities. At Cape UAV, our primary platform is the Autel Robotics EVO Lite 6T Enterprise (also known as the EVO Lite 640T).
Autel Robotics is a trademark of its respective owner; Cape UAV is not affiliated with or endorsed by Autel Robotics.
Technical Specifications for Site Visualization
- 50MP Visual Camera: High megapixel counts allow for a lower Ground Sample Distance (GSD), meaning each pixel represents a smaller area of actual ground. This results in sharper, more detailed maps.
- 640×512 Thermal Sensor: Critical for identifying moisture intrusion, heat loss, or subsurface anomalies during site inspections.
- 12um Pixel Pitch: This spec is vital for thermal clarity. A smaller pixel pitch (measured in micrometers) allows the sensor to detect finer temperature variations, providing superior detail in thermal mapping missions.
By leveraging these specs, we deliver imagery that allows project managers to zoom in on specific site features: such as utility inlets or structural defects: without losing clarity.
The Drone Mapping Workflow
A successful mapping mission is divided into three distinct phases: planning, capture, and processing. Each phase requires technical precision to ensure the final deliverable is useful for site documentation.
1. Pre-Flight Planning
We define the project boundaries using KML files or GPS coordinates. During this stage, we determine the optimal flight altitude. While flying lower increases detail (lower GSD), it also increases the number of photos and total flight time. In Southwest Florida, we must also account for weather patterns and wind speeds to ensure the stability of the drone services provided.
2. Autonomous Data Capture
Manual flying is rarely used for mapping. Instead, we use flight planning software to execute a precise, automated grid. This ensures the drone maintains a consistent altitude and speed, which is necessary for uniform image quality.
3. Data Processing
Once the flight is complete, hundreds: sometimes thousands: of images are uploaded to a photogrammetry engine. The software analyzes the EXIF data of each image (latitude, longitude, and altitude) and uses "keypoint matching" to align them into a single, high-resolution orthomosaic.
Core Deliverables for Site Visualization
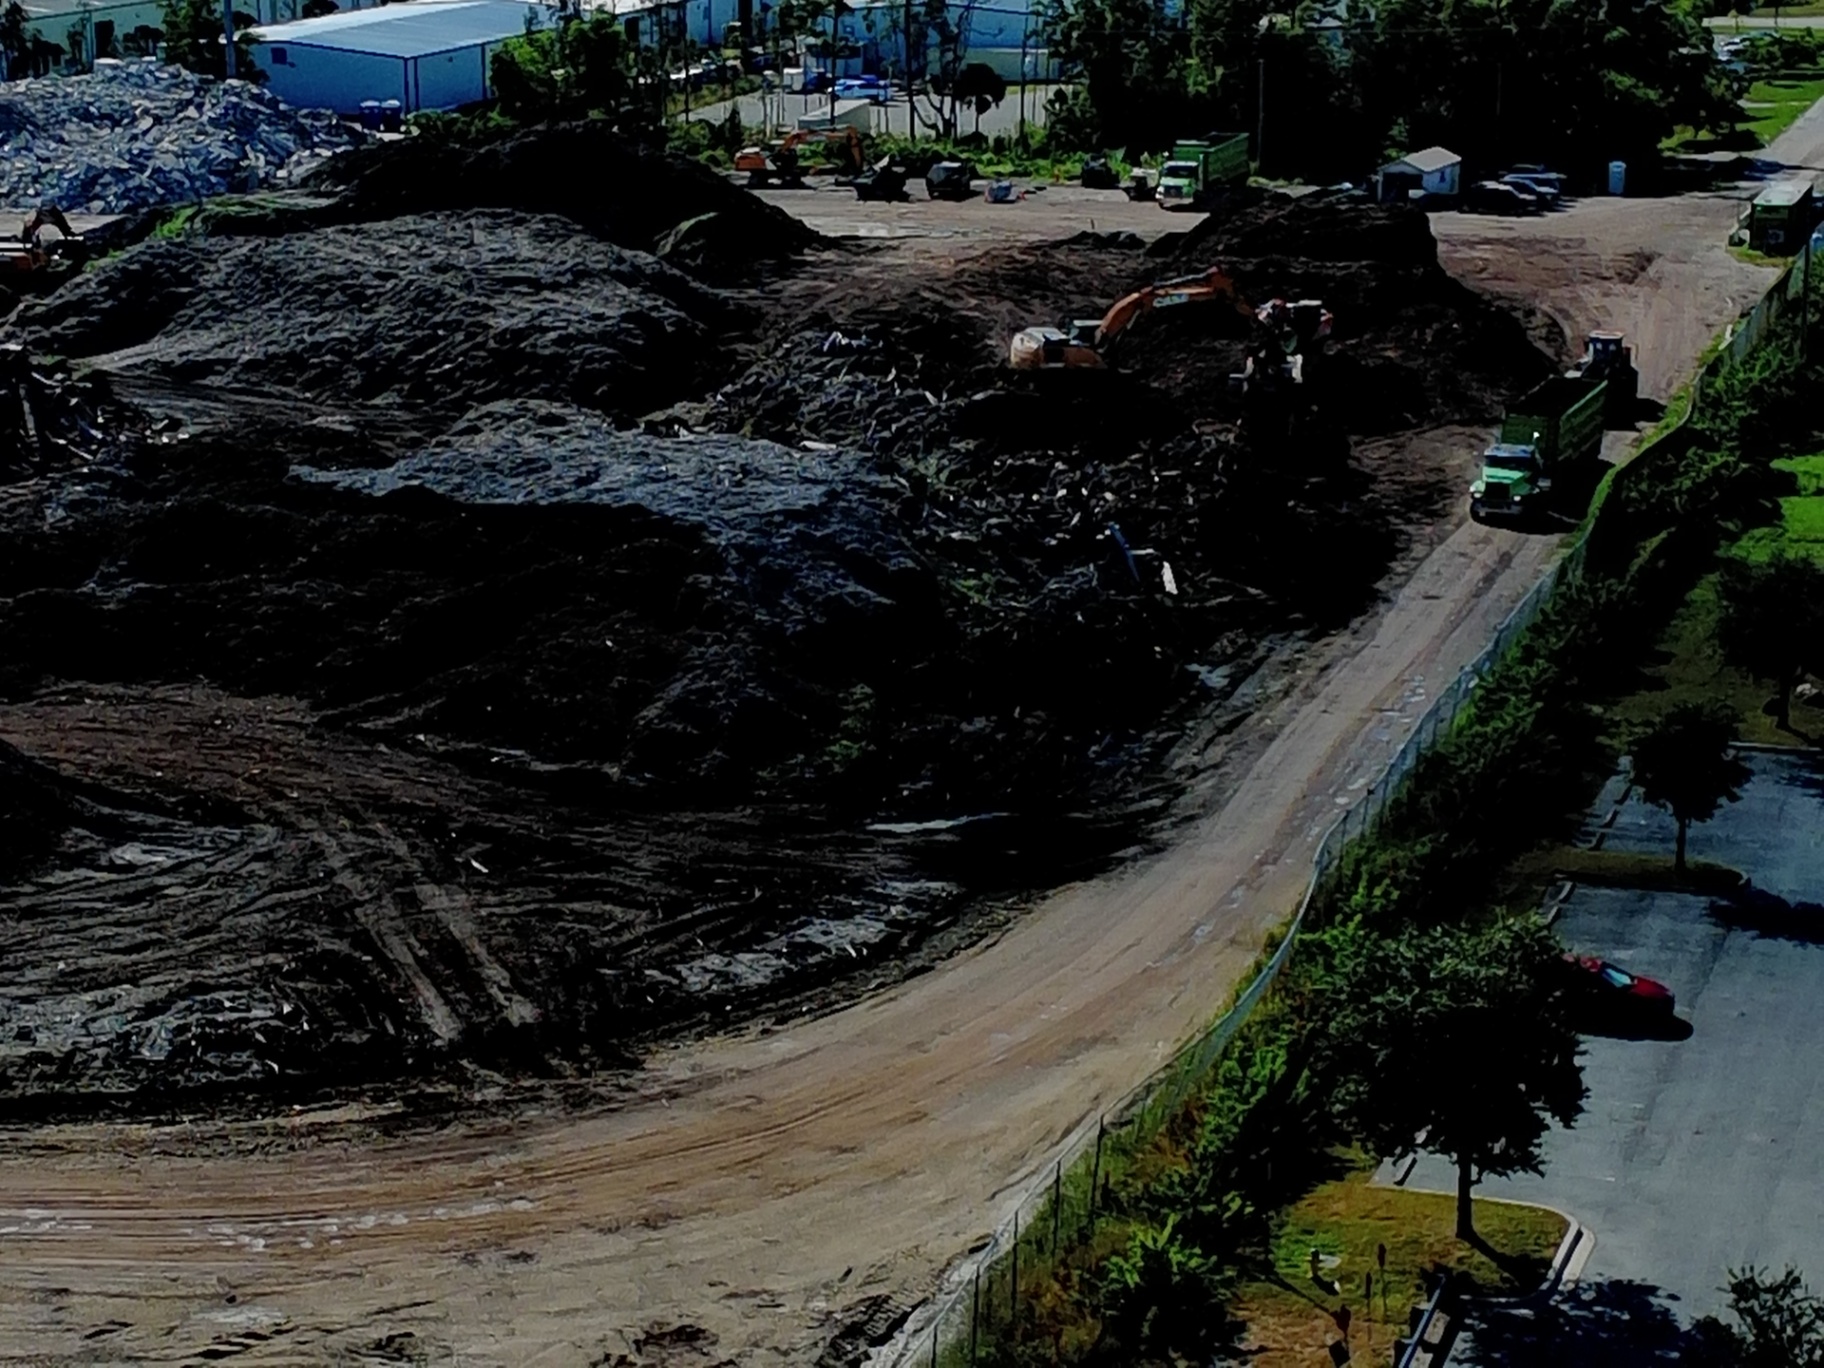
The output of a drone mapping mission is more than just a "pretty picture." It is a suite of data products designed for different professional needs.
High-Resolution Orthomosaics
An orthomosaic is a top-down view of your site that has been corrected for perspective and lens distortion. It acts as a digital twin of the current site conditions. Project managers use these for:
- Progress Tracking: Comparing weekly orthomosaics to visualize construction milestones.
- Site Layout: Overlaying site plans on real-world imagery to identify potential conflicts.
- Stockpile Monitoring: Visualizing material movement across large development tracts.
Digital Surface Models (DSM) and Digital Terrain Models (DTM)
These layers represent the elevation of the site. A DSM includes everything on the ground: buildings, trees, and equipment: while a DTM filters out those objects to show only the bare earth. These are essential for industrial land development and drainage planning.
3D Modeling
By capturing oblique images (photos taken at an angle rather than straight down), we can generate detailed 3D models of structures and terrain. This provides stakeholders with an immersive way to navigate a site from their desktop.

Thermal Mapping: Visualizing the Invisible
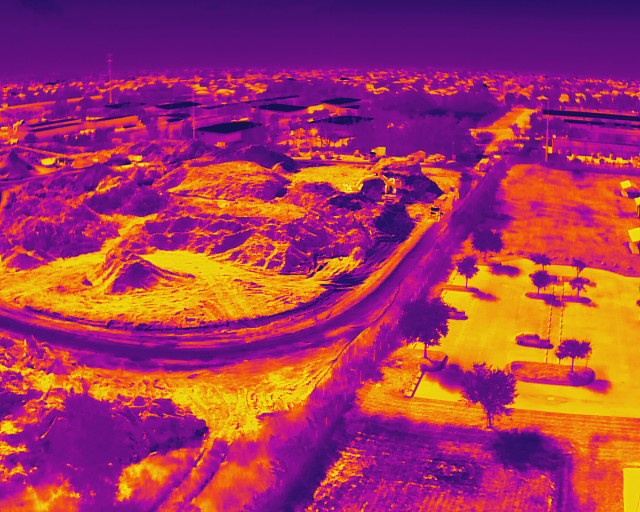
One of the most powerful applications of modern drone technology is the integration of thermal imaging into site maps. In facility maintenance and solar inspections, thermal data reveals what the naked eye cannot see.
Using the 640×512 thermal sensor on our Autel platform, we can create thermal orthomosaics. These maps highlight temperature anomalies across a large area, such as a multi-acre solar farm or a massive industrial roof.
Applications for Thermal Site Visualization
- Roof Inspections: Identifying potential water intrusion points or insulation failures by detecting "hot spots" where moisture retains heat.
- Solar Inspections: Locating malfunctioning cells or panels that are operating at abnormal temperatures.
- Subsurface Utility Detection: In some cases, thermal variations can help identify the path of underground lines or leaks in steam pipes.
The ROI of Drone Mapping in Southwest Florida
For B2B clients in construction and property management, drone mapping is an investment in risk mitigation and efficiency.
Speed and Safety
Traditional site walks are time-consuming and can involve safety risks, especially on active construction sites or steep roofs. A drone can map a 50-acre site in a fraction of the time it takes to traverse it on foot. This eliminates the need for ladders, lifts, or putting personnel in hazardous areas.
Improved Communication
A high-resolution map provides a "single source of truth." When everyone: from the owner to the contractor: is looking at the same updated site visualization, misunderstandings are reduced. This leads to faster decision-making and fewer costly delays.
Documentation and Dispute Resolution
High-resolution aerial imagery provides a chronological record of site conditions. If a dispute arises regarding material placement or project timelines, the orthomosaic acts as an undeniable historical record.
Conclusion: Data-Driven Planning
Drone mapping is no longer just about taking photos; it is about gathering actionable data. Whether you are managing a luxury real estate development in Cape Coral or overseeing an industrial facility's maintenance, the clarity provided by 50MP visual sensors and 640×512 thermal imaging is transformative. By integrating these tools into your workflow, you gain the ability to spot anomalies early, document progress precisely, and support the overall efficiency of your operations.
As technology continues to advance, the gap between those using aerial visualization and those relying on traditional methods will only widen. Proactive site management starts with the right view.
Important Disclaimer
- Mapping: Our data is for planning purposes and is not a substitute for a licensed land survey.
- Thermal: Thermal results indicate anomalies and are not a substitute for evaluation by a licensed professional.
Important Disclaimer
Our data is for planning purposes and is not a substitute for a licensed land survey. Thermal results indicate anomalies and are not a substitute for evaluation by a licensed professional.